Detecting False Sharing with Perf C2C
In a previous post we showed how false sharing cause serious slowdown in an application. However, we did not discuss how it can be debugged after-the-fact. While reasoning about your code can help you remove cases of false sharing ahead of time, there may be cases that are well-hidden in the code, or the result of runtime behavior of the application. For cases like this, tools can help. Perf C2C can be used for this exact purpose.
Link to the source code
Perf C2C
Perf C2C (Cache to Cache) is for analyzing shared data C2C/HITM. HITM stands for a load that hit in a modified cache line. The primary purpose of the tool is to report details on cache lines with the highest contention (e.g., the highest number of HITM accesses). More information can be found at the man page here.
Example Code
To show off how to use Perf C2C, we’ll use our sample code from last time. This includes a simple “work” function that increments an atomic integer, and a function that launches multiple threads, each of which calls this “work” function with a different atomic integer. The false sharing comes from the fact that all four of the atomic integers wind up on the same cache line.
void work(std::atomic<int>& a) {
  for(int i = 0; i < 100000; ++i) {
    a++;
  }
}
void falseSharing() {
  // Create a single atomic integer
  std::atomic<int> a;
  a = 0;
  std::atomic<int> b;
  b = 0;
  std::atomic<int> c;
  c = 0;
  std::atomic<int> d;
  d = 0;

  // Four threads each with their own atomic<int>
  std::thread t1([&]() {work(a)});
  std::thread t2([&]() {work(b)});
  std::thread t3([&]() {work(c)});
  std::thread t4([&]() {work(d)});

  // Join the 4 threads
  t1.join();
  t2.join();
  t3.join();
  t4.join();
}
This code was compiled using g++10 using the following command.
g++ false_sharing.cpp -lbenchmark -lpthread -O3 -march=native
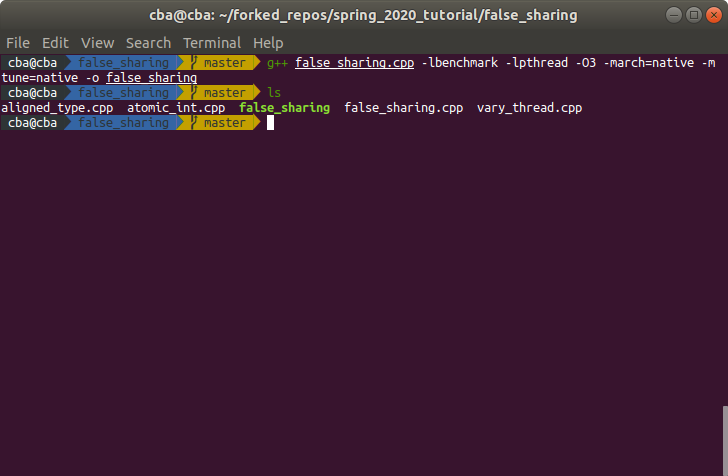
The full source code can be found here.
Using Perf C2C
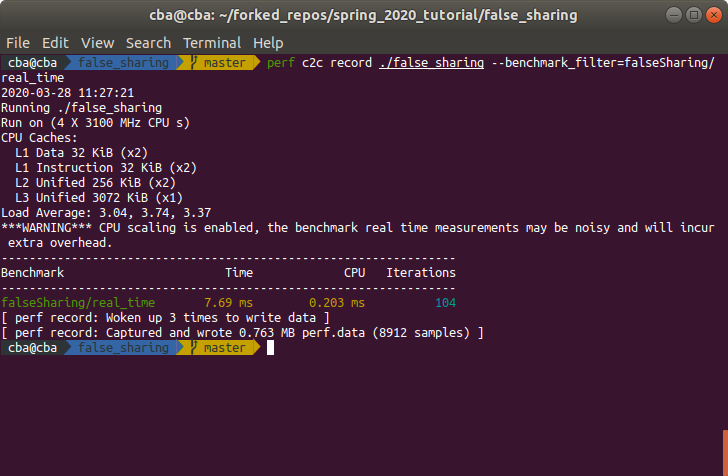
Last time we showed that false sharing cause a ~3x slowdown compared to a serial implementation, with a ~40% miss-rate in the L1 cache. Let’s see what information we can get with Perf C2C. Let’s run the the application using the following:
perf c2c record ./false_sharing --benchmark_filter=falseSharing/real_time
Now we can load the data with perf. By default we have to options to look at; loads or stores.
perf report
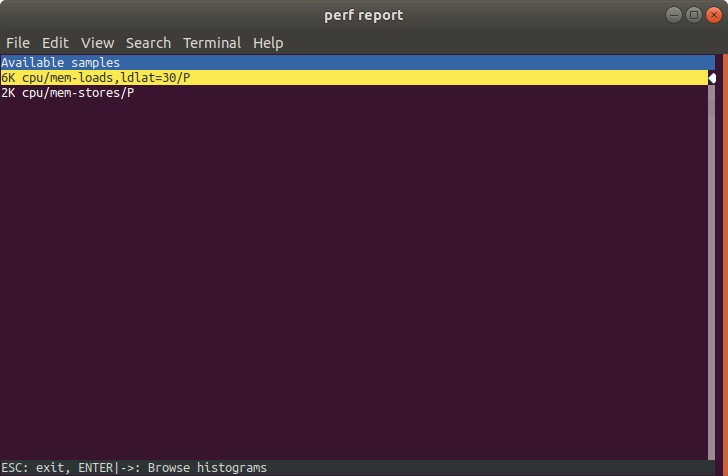
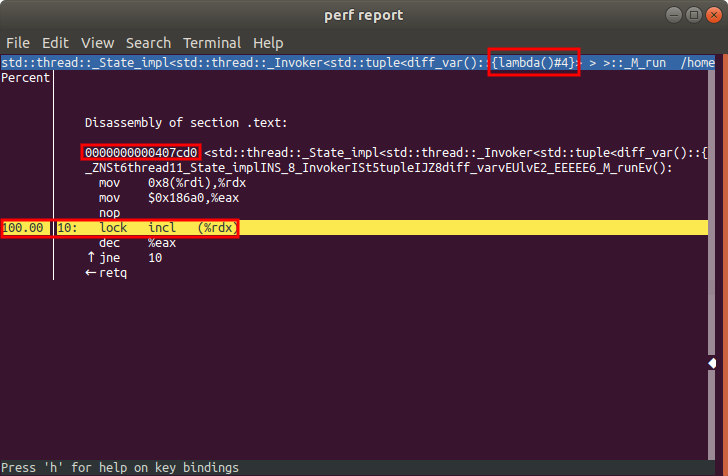
Let’s look at the samples for loads. Unsurprisingly, we find that most of the samples are associated with the threads launched by our false sharing benchmark. The long names of the symbols come from the fact we are launching new threads using a lambda.
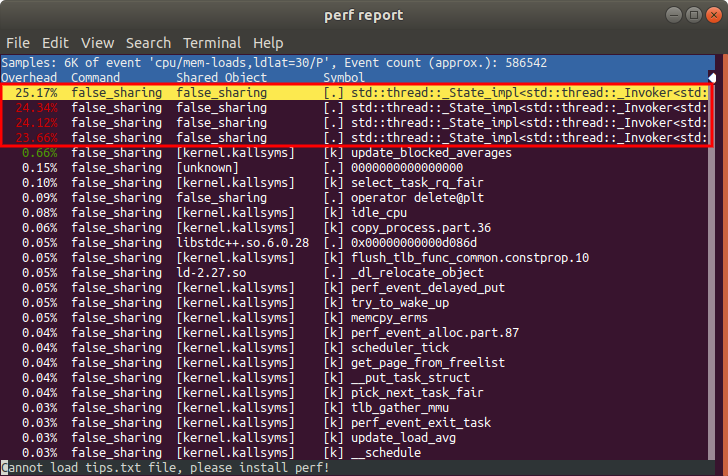
We find that the load and store samples are all associated with the atomic increment. Let’s keep track of something from this perf window. Let’s keep track of where this atomic increment is located in memory. We find the base address of the lamda is at 0x407cd0, and the incl is at an offset by 0x10. We’ll therefore focus on 0x407ce0 (the sum of the base address and the offset).
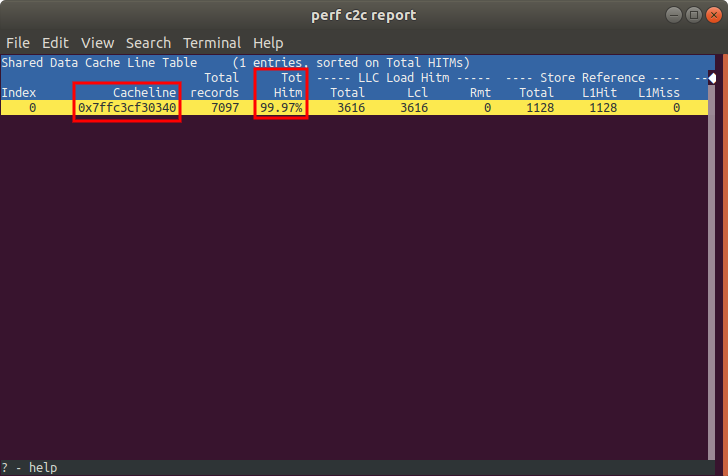
Now let’s exit out, and load in the data with c2c. We get a “Shared Data Cache Line Table” with a single entry (the cache line that holds all 4 of the atmoic integers). Notice the high count of “Hitm”. As a reminder, these are cases where a thread misses in its L1 cache, and finds the line in a modified state in a different L1 cache. This indicates that multiple threads are writing to the same cache line, and sending invalidations to each other.
perf c2c report
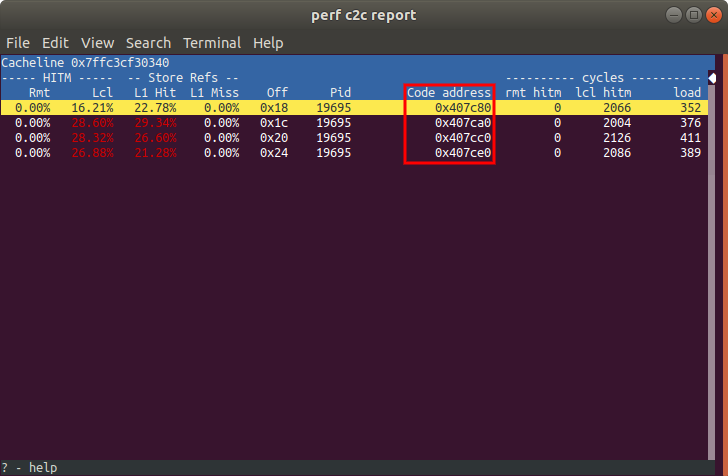
We can get more information about a cache line by pressing d while it is selected in the table. When we do this, we find that cache line is being written at 4 places (our 4 threads performing atomic increments). One thing to observe here is the code address. Notice how one of the entries is 0x407ce0. This was the address of the incl instruction we looked at earlier! The other code addresses correspond to the incl instruction being executed on the other 3 threads.
Compilation in Debug Mode
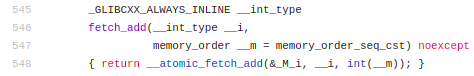
If you compiled your application with the -g flag (instead of -O3), you may see a different hotspot in your application. Now, it looks like our hotspot is at atomic_base.h, a file that we did not write, or directly include.
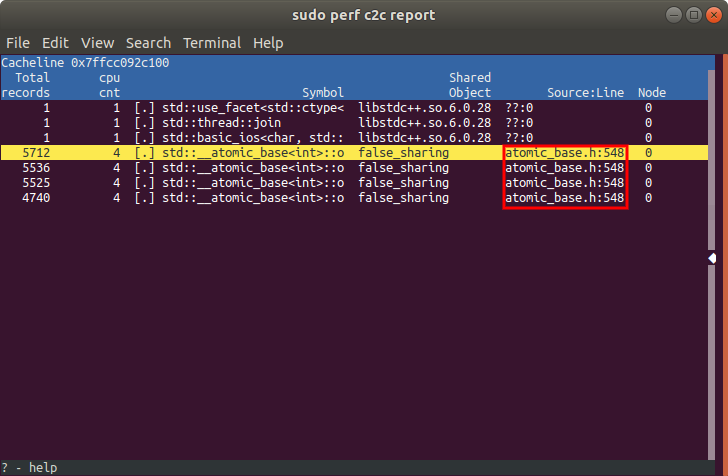
However, if we look up what is actually at line 548 of atomic_base.h, we find that it is just the intrinsic for performing an atomic increment.
In this, and many other cases, having a call graph can help you get the necessary context to debug your program. If we take the same code, but record with the -g flag, we can trace back how we got to atomic_base.h. We can load in our data to perf the same way we did previously.
perf c2c record -g ./false_sharing --benchmark_filter=falseSharing/real_time
perf c2c report
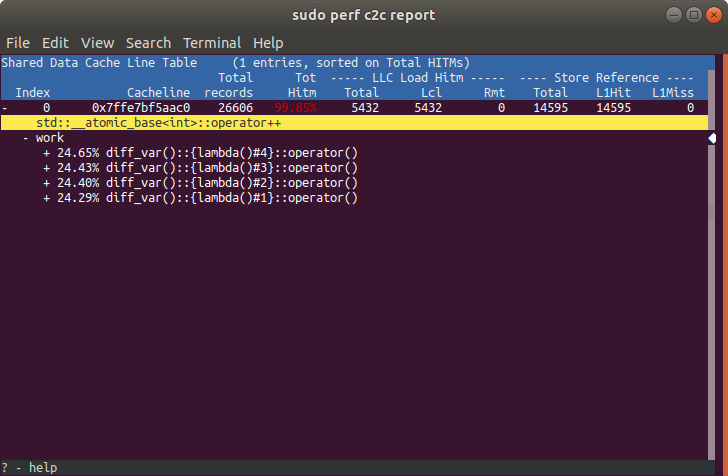
Now, we can see that our our atomic increment comes from atomic_base.h, which is called from the work function, which is running in our 4 threads launched with lambdas.
Concluding remarks
This is by no means the only way to debug false sharing in an application. However, this should get you going in the right direction, and introduce you to some of the amazing tools out there for debugging performance problems in your code.
Thanks for reading,
–Nick